
Sales are mostly stable in a broad range, but inventories are rising and consumer sentiment souring.
The Census Department New Residential Sales report for April 2026 shows a 6.2 percent decline in sales.
New Home Sales
- Sales of new single-family houses in April 2026 were at a seasonally-adjusted annual rate of 622,000.
- This is 6.2 percent (±12.8 percent) below the March 2026 rate of 663,000, and is 11.3 percent (±11.5 percent) below the April 2025 rate of 701,000.
For Sale Inventory and Months’ Supply
- The seasonally-adjusted estimate of new houses for sale at the end of April 2026 was 489,000.
- This is 1.7 percent (±1.2 percent) above the March 2026 estimate of 481,000, and is 2.2 percent (±3.9 percent)* below the April 2025 estimate of 500,000.
- This represents a supply of 9.4 months at the current sales rate. The months’ supply is 8.0 percent (±16.3 percent) above the March 2026 estimate of 8.7 months, and is 9.3 percent (±13.5 percent) above the April 2025 estimate of 8.6 months.
Sales Price
- The median sales price of new houses sold in April 2026 was $422,500.
- This is 8.0 percent (±9.3 percent) above the March 2026 price of $391,100, and is 2.2 percent (±9.0 percent) above the April 2025 price of $413,600.
- The average sales price of new houses sold in April 2026 was $508,800. This is 0.7 percent (±8.6 percent) above the March 2026 price of $505,200, and is 1.1 percent (±7.1 percent) below the April 2025 price of $514,300.
General Comments
The margin of error in these monthly reports is huge, ±16.3 percent on supply and ±12.8 percent on sales.
The Commerce Department does not have a lot of confidence in the numbers, nor should anyone else.
It’s better to focus on long-term trends, and that’s why my charts do.
Long-Term Trends
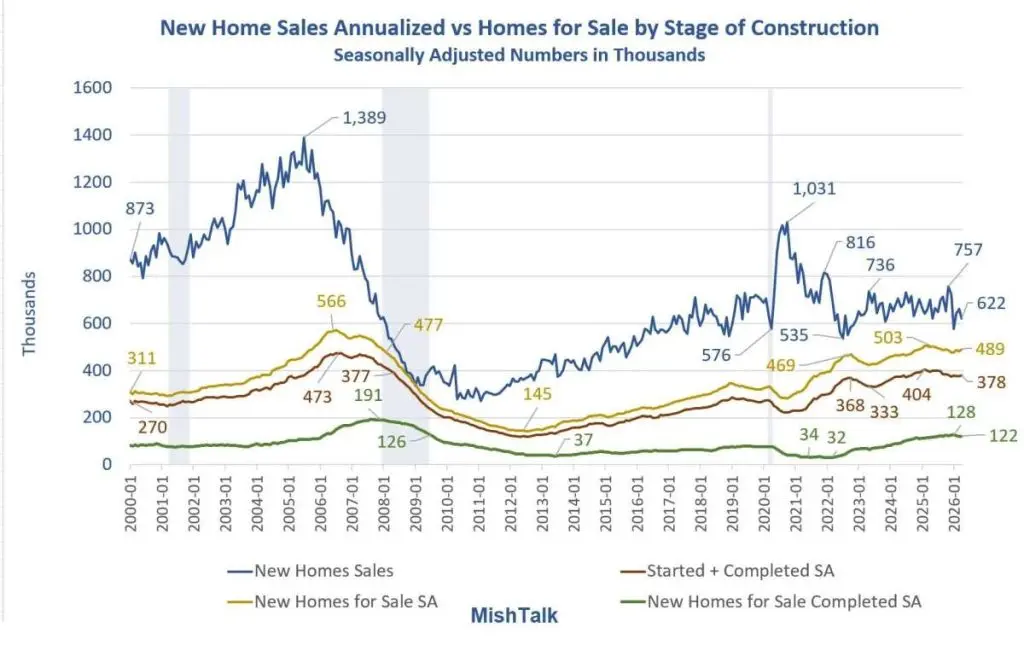
From 2010 until 2019 (first set of arrows), people were buying homes faster than builders were accumulating unsold spec homes.
That was followed by a massive post-Covid spike in sales (no arrows) with a drop in unsold spec homes.
Since May of 2023 (second set of arrows) builders have had no traction. Sales are generally down, and inventory of unsold homes is generally rising.
New Homes For Sale by Stage of Construction
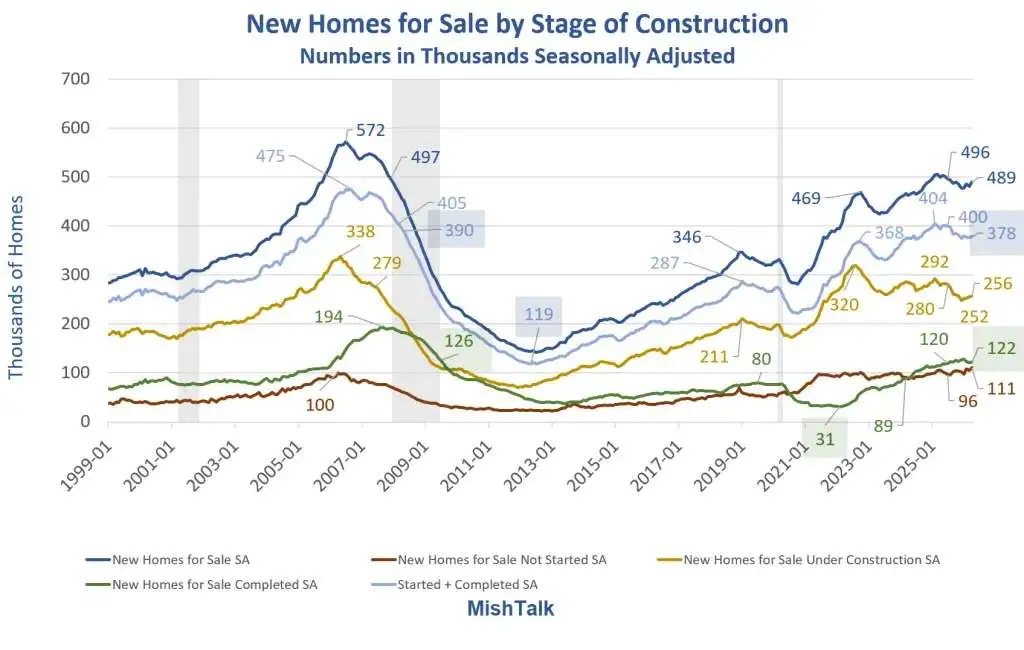
New Homes for Sale by Stage of Construction in Thousands
- New Home for Sale Total: 489
- Not Started: 111
- Finished: 122
- Under Construction: 256
- Under Construction or Completed: 378
I calculate total as the sum of Not Started, Finished, and Under Construction. The number may vary slightly from reported totals.
The number of finished homes for sale is high. Builders are under pressure to sell these homes in a very tough market, with rising mortgage rates too.
Unlike finished lots, started homes also represent a huge builder commitment. These are also high numbers but down a bit from a few months ago.
New Home Sales Annualized vs Homes for Sale by Stage of Construction
New Homes for Sale Supply
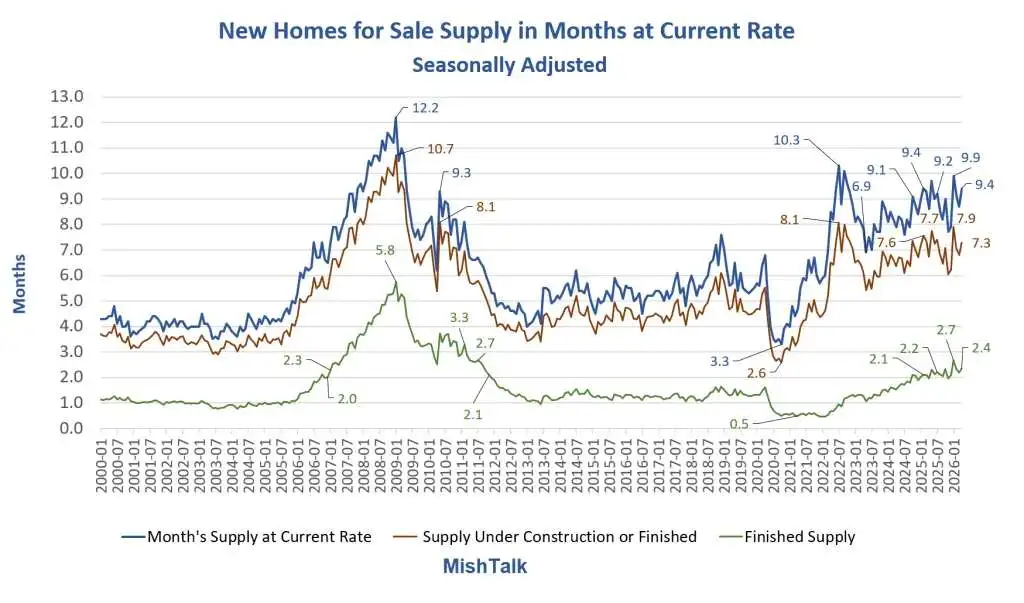
New Homes for Sale Supply in Months
- Official Supply: 9.4 Months
- Finished Supply: 2.4 months
- Started or Finished Supply: 7.3 Months
I don’t consider a vacant lot as a home for sale. So, I offer two alternative measures.
We see the same issue here. Builders are sitting on a lot of finished or started homes. Supply relative to sales is high and rising.
New Homes for Sale as Percent of New Home Sales
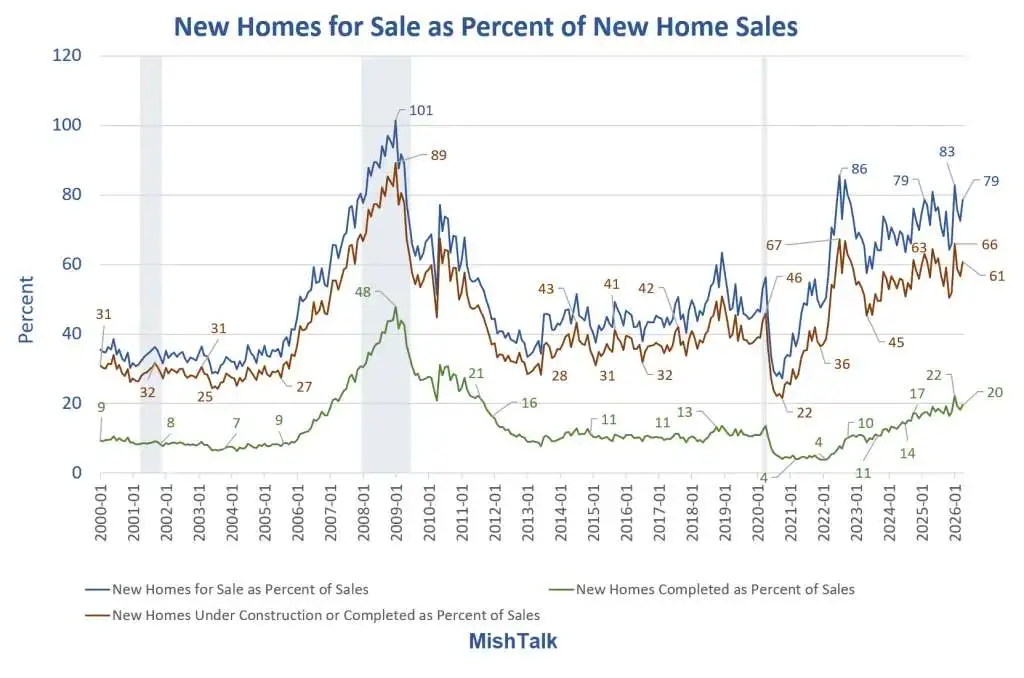
For Sale Percent of New Home Sales
- Total: 79 percent
- Under Construction or Completed: 61 percent
- Completed: 20 percent
These numbers will rocket if there is prolonged drop in sales from here.
Mortgage Rates
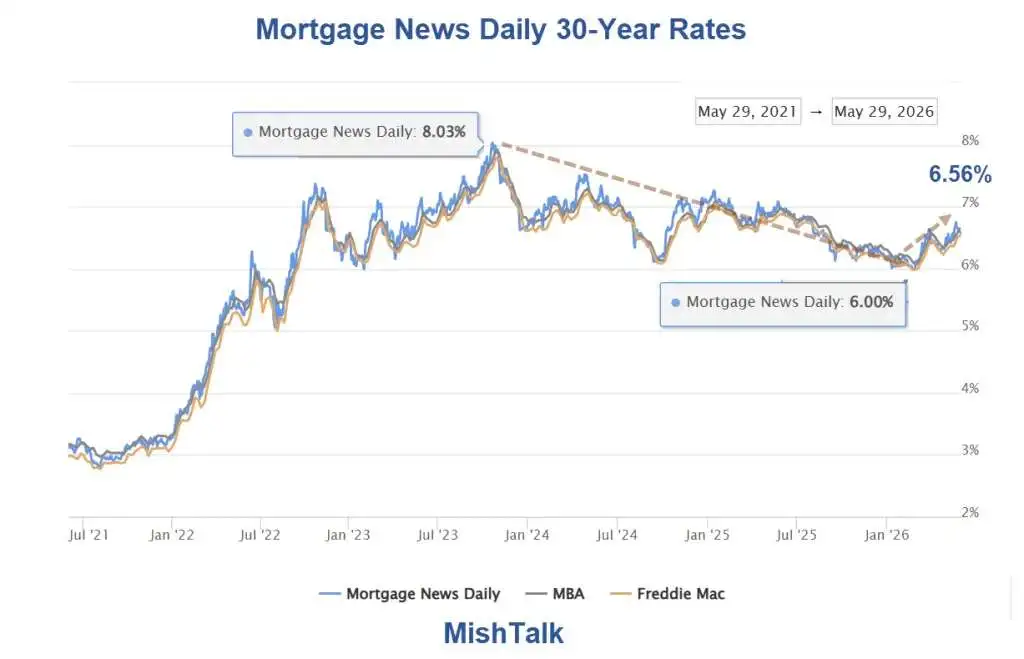
Between October 2023 and February 2026 Mortgage rates dropped from 8.03 percent to 2.00 percent.
October 2023 sales were 689,000. February 2026 sales were 641,000. Sales are now 622,000 and mortgage are rising.
This is evidence of a modest amount of price insensitive buyers, most likely wealthy buyers willing to pay cash and don’t care about rates.
Everyone else is trapped in setup where they are unable or unwilling to swap a 3 percent mortgage for a 6 percent mortgage.
Builders are also stuck. They have to sell. This puts puts pressure on builders, but with rising rates, potential buyers are not getting much if any relief from discounts.
Meanwhile, credit stress is high and rising. And consumers are in a seriously foul mood.
Related Posts
May 26, 2026: Consumer Credit Stress Is Comparable to the Great Recession
Auto delinquencies are at a new record and credit cards are near record high.
May 26, 2026: National Home Prices Decline for the First Time Since July 2025
I am pleased to report a month-over-month home price decline. But don’t get too excited.
May 28, 2026: PCE Inflation Spikes Again, Year-Over-Year Highest Since May 2023
Year-over-year PCE inflation jumped to 3.8 percent. The Fed wants 2.0 percent.
May 28, 2026: Inflation Expectations Surge in Two Distinct Consumer Confidence Surveys
57% of consumers say high prices are eroding their personal finances.
This post originated on MishTalk.Com
Thanks for Tuning In!
Mish
Read the full article here