


Silver is the new silver.
Always has been.
The chart looks exciting, but anyone looking at the bigger picture should be ecstatic.


Silver has a long way to go.
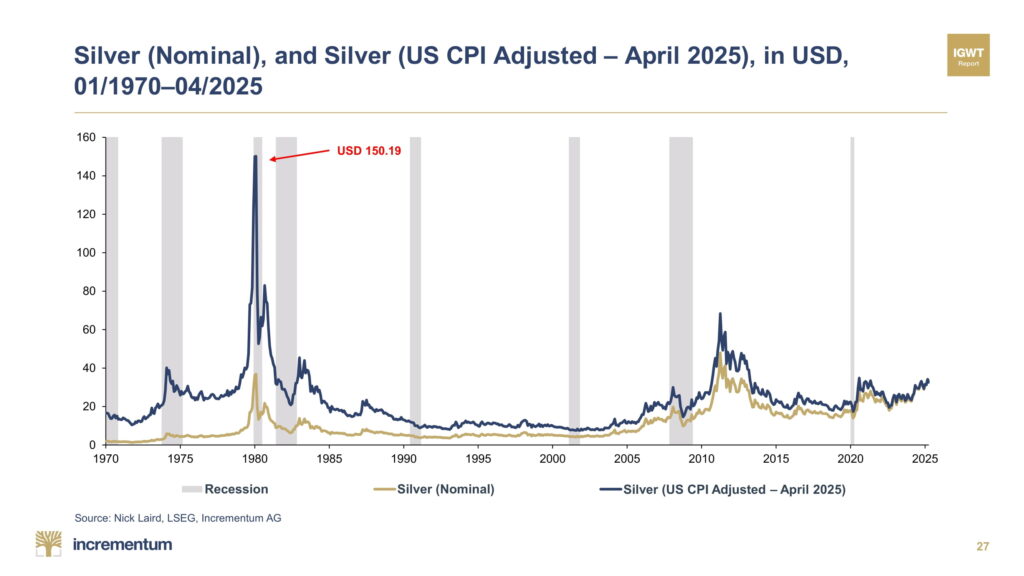
If you look at the silver price historically, you can see silver has touched the $50 glass ceiling twice before.
So, it is fast approaching that point once more.

One way to measure how high silver could go is to look at the Dow/Silver Ratio from 1970 – Present.

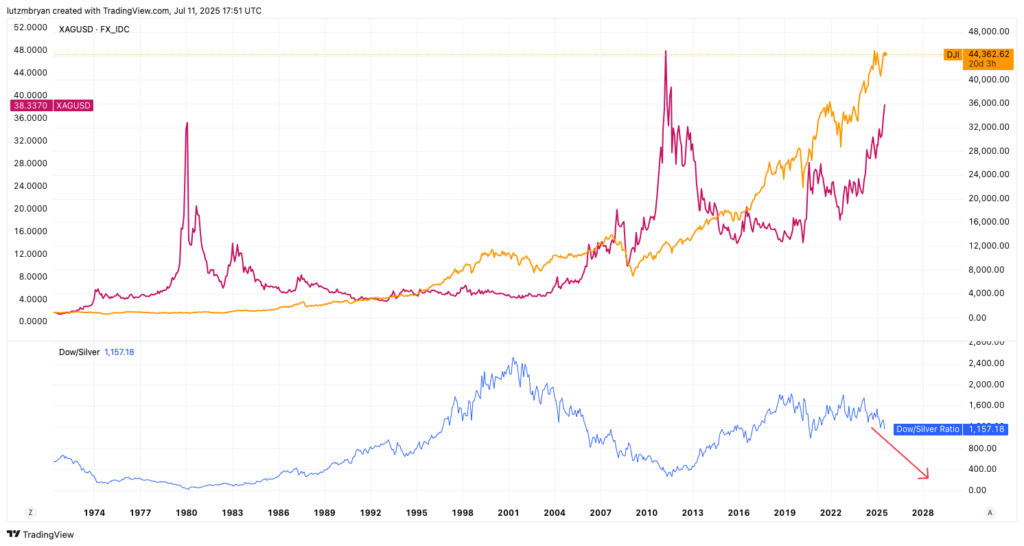
You can see the Dow / Silver ratio is lowest around 1980 and 2013. As the ratio moves down, silver prices move up.
Take 1980, for example, the silver price peaked at $50, which means the Dow/Silver ratio bottomed out. It hit 24.5.
Let’s say the Dow/Silver ratio bottomed out there today.
The Dow Jones is sitting at 44,390.
That would put the silver price at $1,811 per ounce. That’s unrealistic.
Let’s say the Dow crashes 25% from here.
That puts the price of silver at $1358 per ounce.
50% crash?
$905.
It’s either that or the price of silver keeps pushing upward to suppress the ratio.
Silver’s certainly suppressing the gold/silver ratio.
Recently, silver is pushing past gold, leading the way.
Come mid-august, we’re due for dowry buying season, which will most likely launch the price of silver even higher into possibly october.
Read the full article here


