

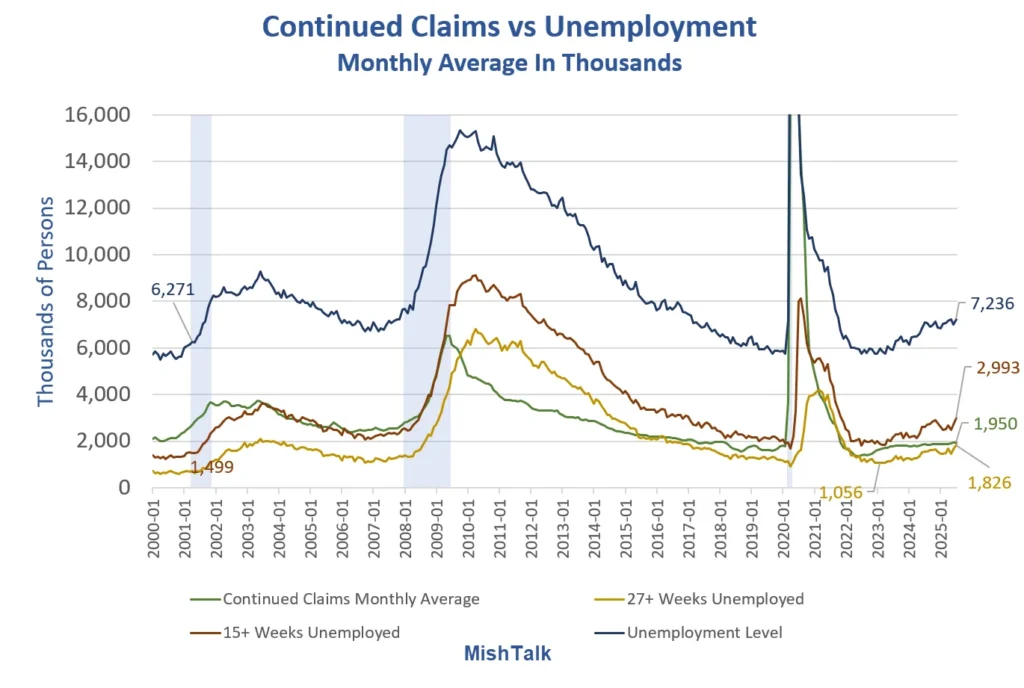
A slow rise in continued unemployment claims masks a growing problem.
I created the above chart by comparing the monthly average of continued unemployment claims to unemployment levels.
Unemployment claims are from the department of labor while the unemployment levels are from the less accurate BLS household survey.
Nonetheless, the trends tell the story.
Continued Claims vs Unemployment Detail
Change Since January 2024
Unemployment Level: 1.087 million
15+ Weeks Unemployment: 844,000
27+ weeks Unemployment: 554,000
Continued Claims: 175,000
What’s Happening?
People have exhausted all of their benefits.
In addition, job hopping is in play.
Eligibility…
Read the full article at ACTIVISTPOST.COM